Visualizing
Gene Disease Association
Adobe Illustrator
d3.js, JavaScript, jQuery, jQuery UI, AJAX
Node.js, Express.js, MySQL, AWS, API
My Role in This Project (alpha version)
Position:
Project/Research Lead, Design & Engineering
Design:
Data Visualization, User Interface Design, Information Architecture, User Experience, Concept, Research
Data:
API design and implementation: Node.js, Express.js, MySQL, SQL
Engineering:
Front-end: D3.js, JavaScript, HTML5, SASS
Back-end & DevOps: Node.js, Express.js, AWS EC2
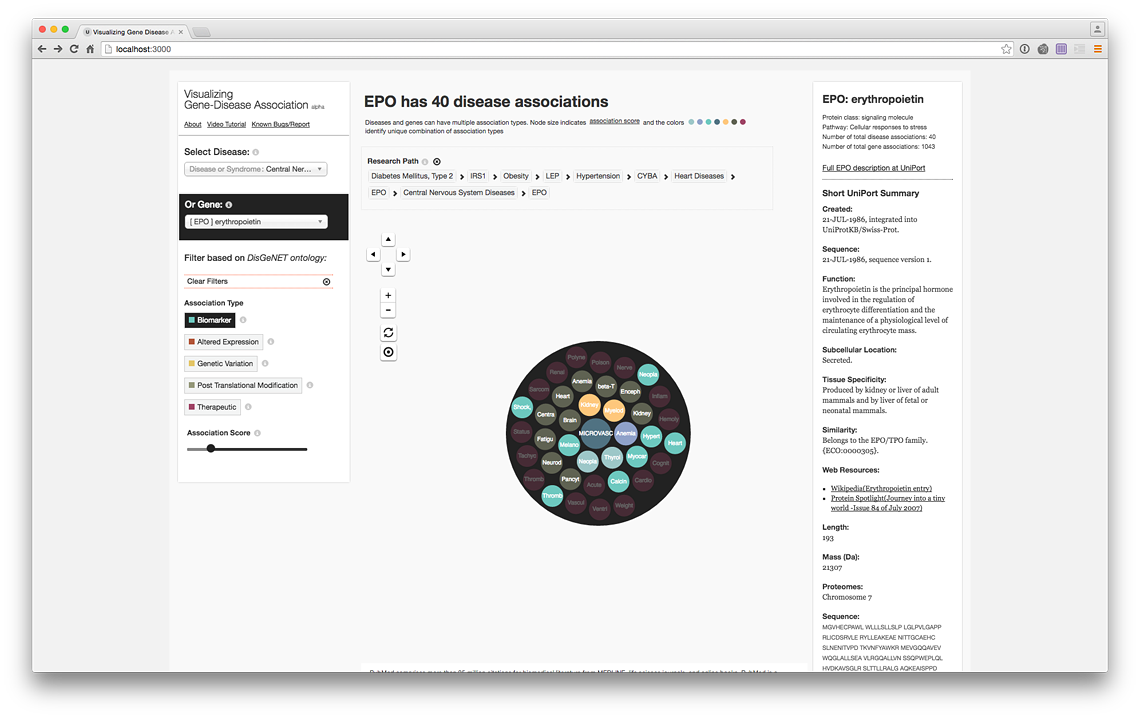
Visualizing Gene-Disease Association (alpha v 0.1) is my most recent research project [2016]. The current version visualizes 6,753 diseases and 7,878 genes, tracing the complex mechanisms by which diseases arise. Each disease comes with a description and each gene with a detailed info panel containing its sequence and properties. Further context is provided by linking these connections to the PubMed database containing scientific papers and evidence about the association between the disease and genes.
Inspired by the Double Helix by James D. Watson, the final goal of the project is to arrive at visual language and data visualizations that simplify the communication of G-D associations. This very early alpha version is for exploratory and test purposes of the backend infrastructure only. I hope to be able to launch a beta version containing a set of data visualizations and networks which will make the data more accessible in the next six months. I am currently transitioning the architecture to a universal (SPA) application. More details, methodology and the data sources are available at the project website.
Current status: Ongoing
Alpha Version - exploratory UI and visualization for testing of infrastructure and data sources
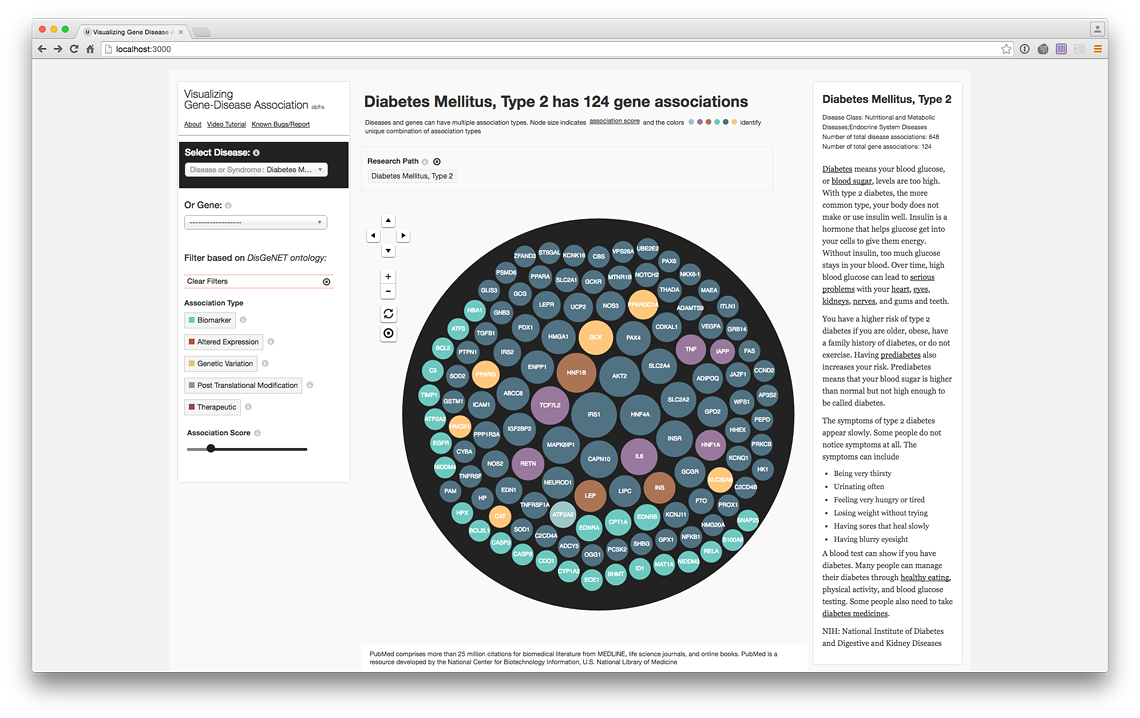
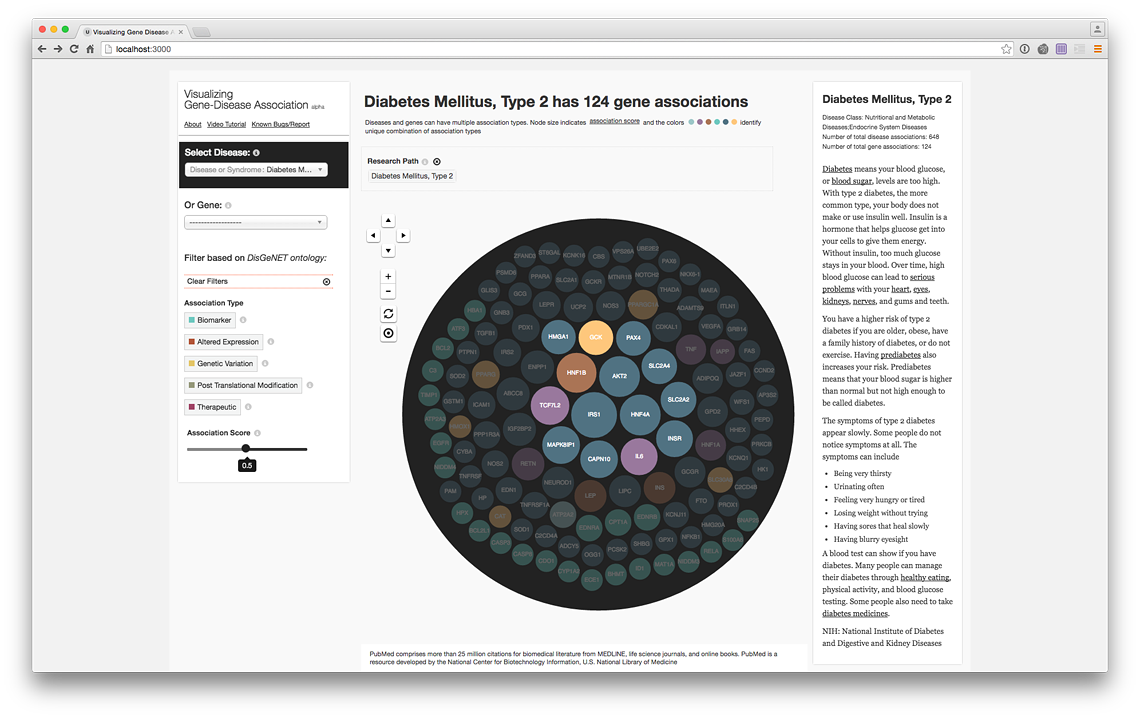
Disease View (live @ project website)
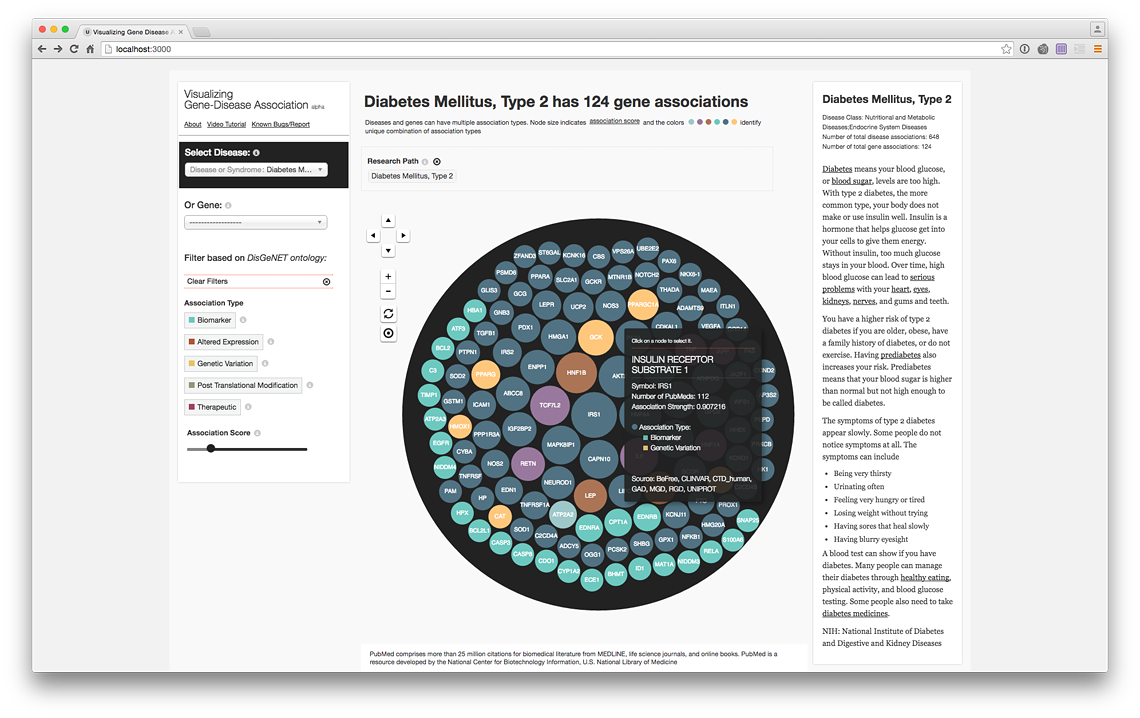
Contextualizing tooltip (live @ project website)
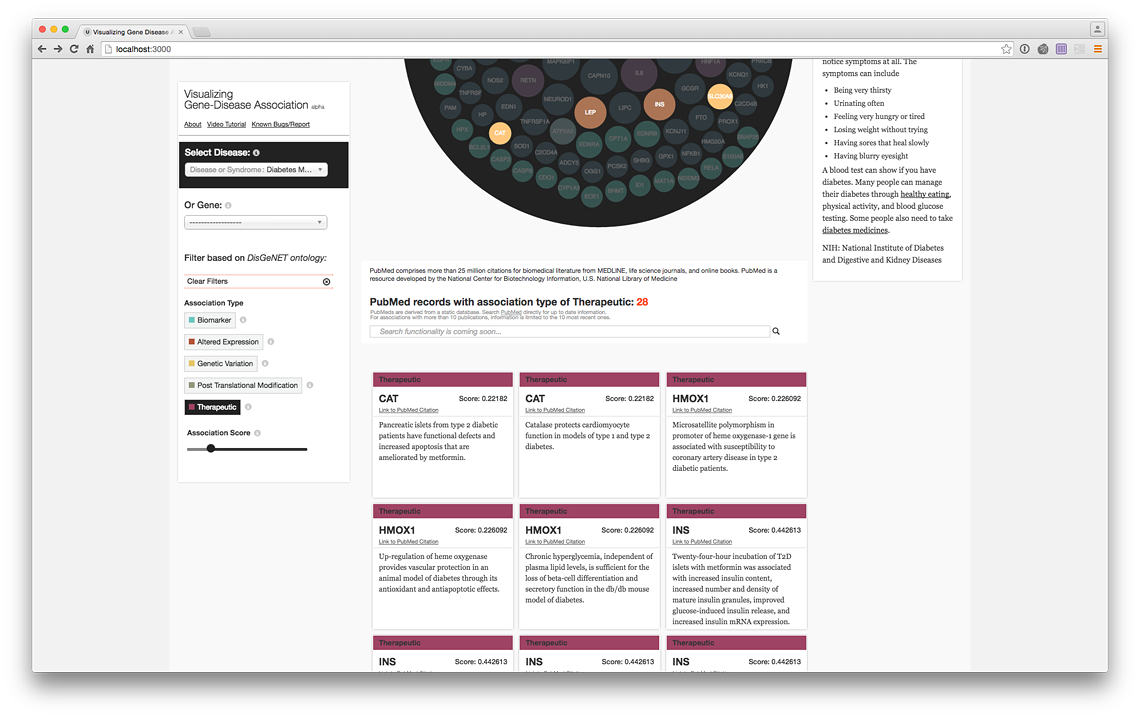
Filter genes with therapeutic association only (live @ project website)
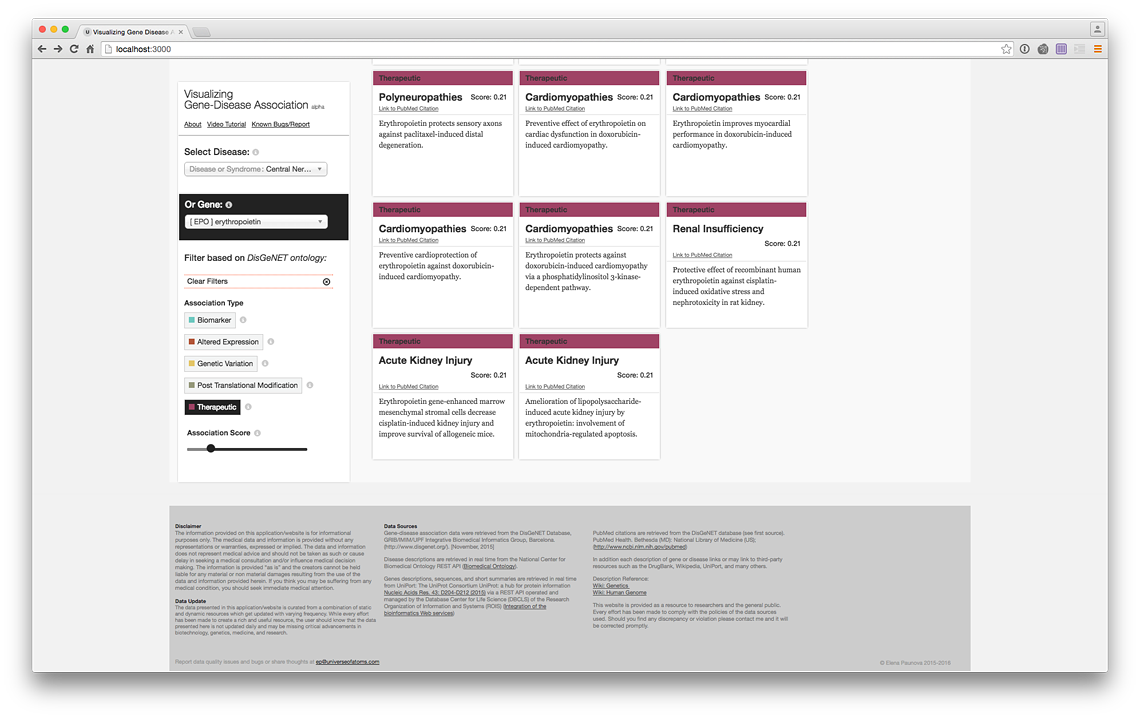
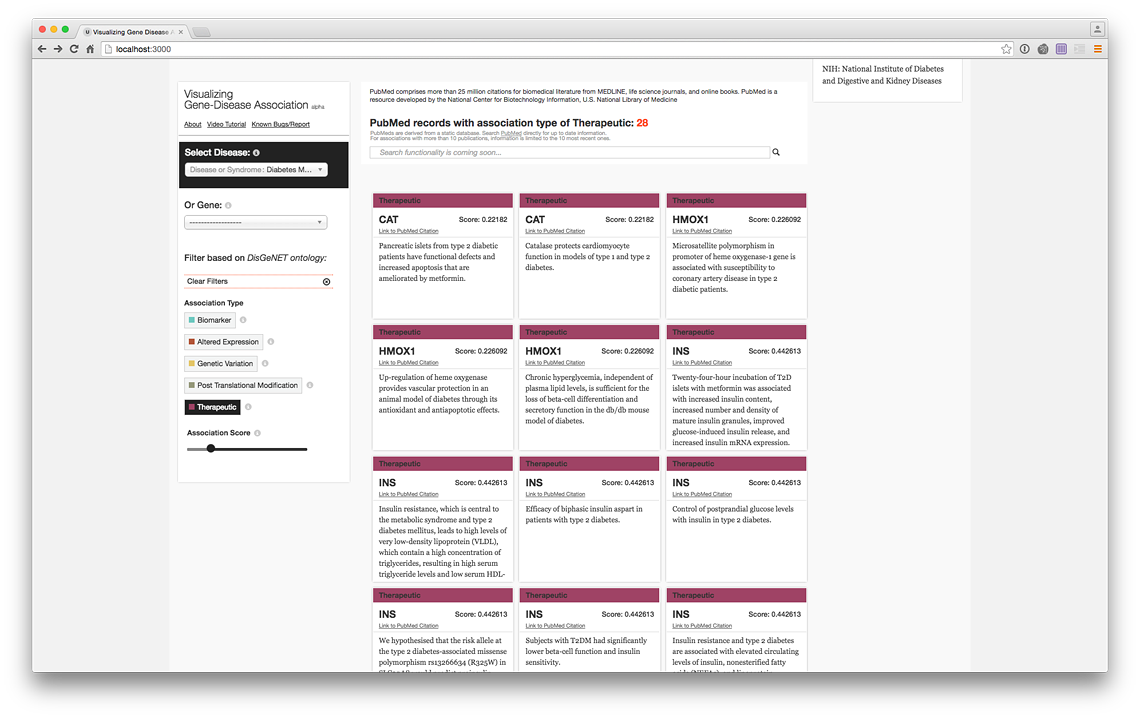
PubMed Records of the genes with therapeutic association (live @ project website)
More records (live @ project website)
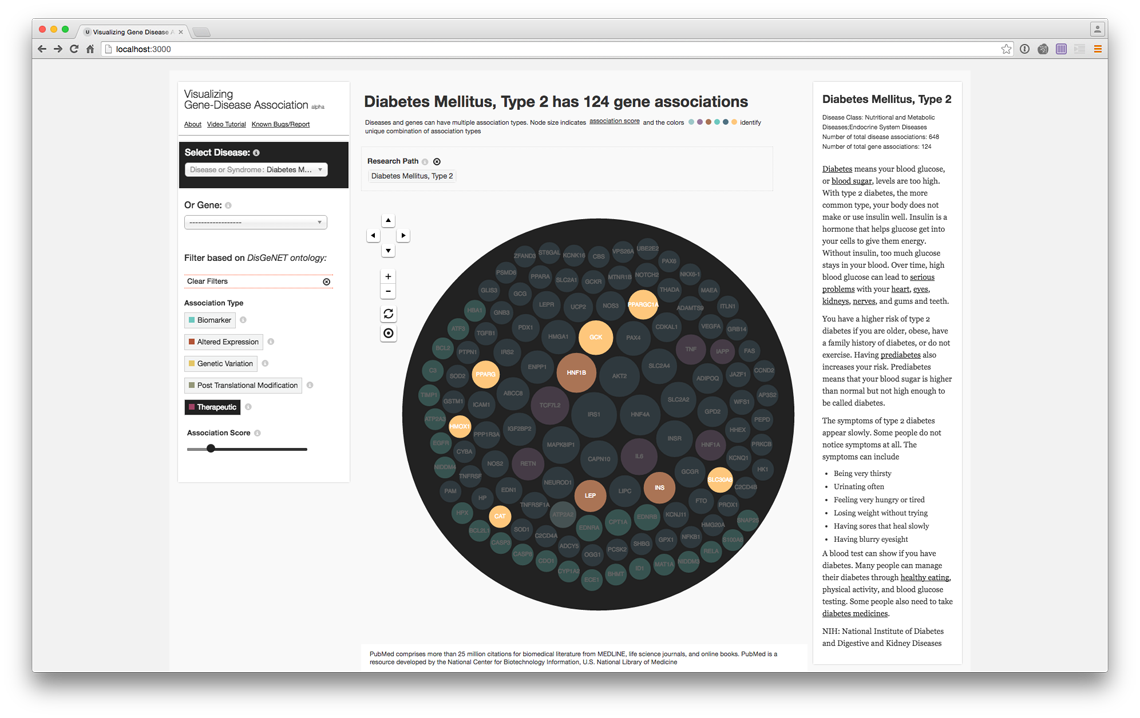
Filter by association score strength (live @ project website)
Your research path helps you trace back your steps and hypothesis: from Diabetes to Obesity to Hypertension to Heart Disease.
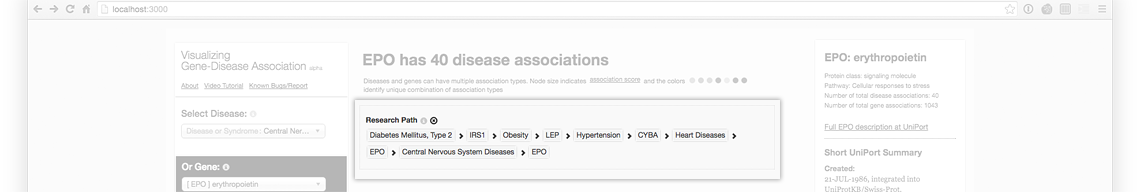
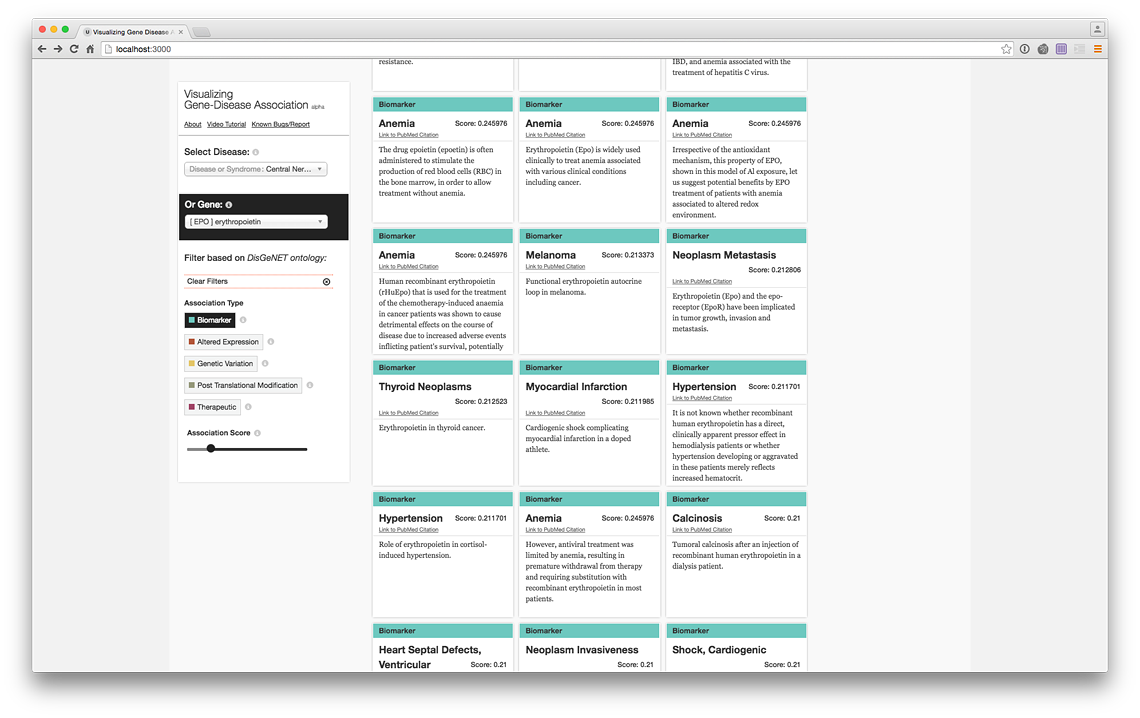
Erythropoietin (EPO) Biomarker associations (live @ project website)
Erythropoietin (EPO) Biomarker PubMed Records (live @ project website)
Erythropoietin (EPO) Therapeutic associations (live @ project website)